Power BI Data Visualization: Turning Numbers into Powerful Stories
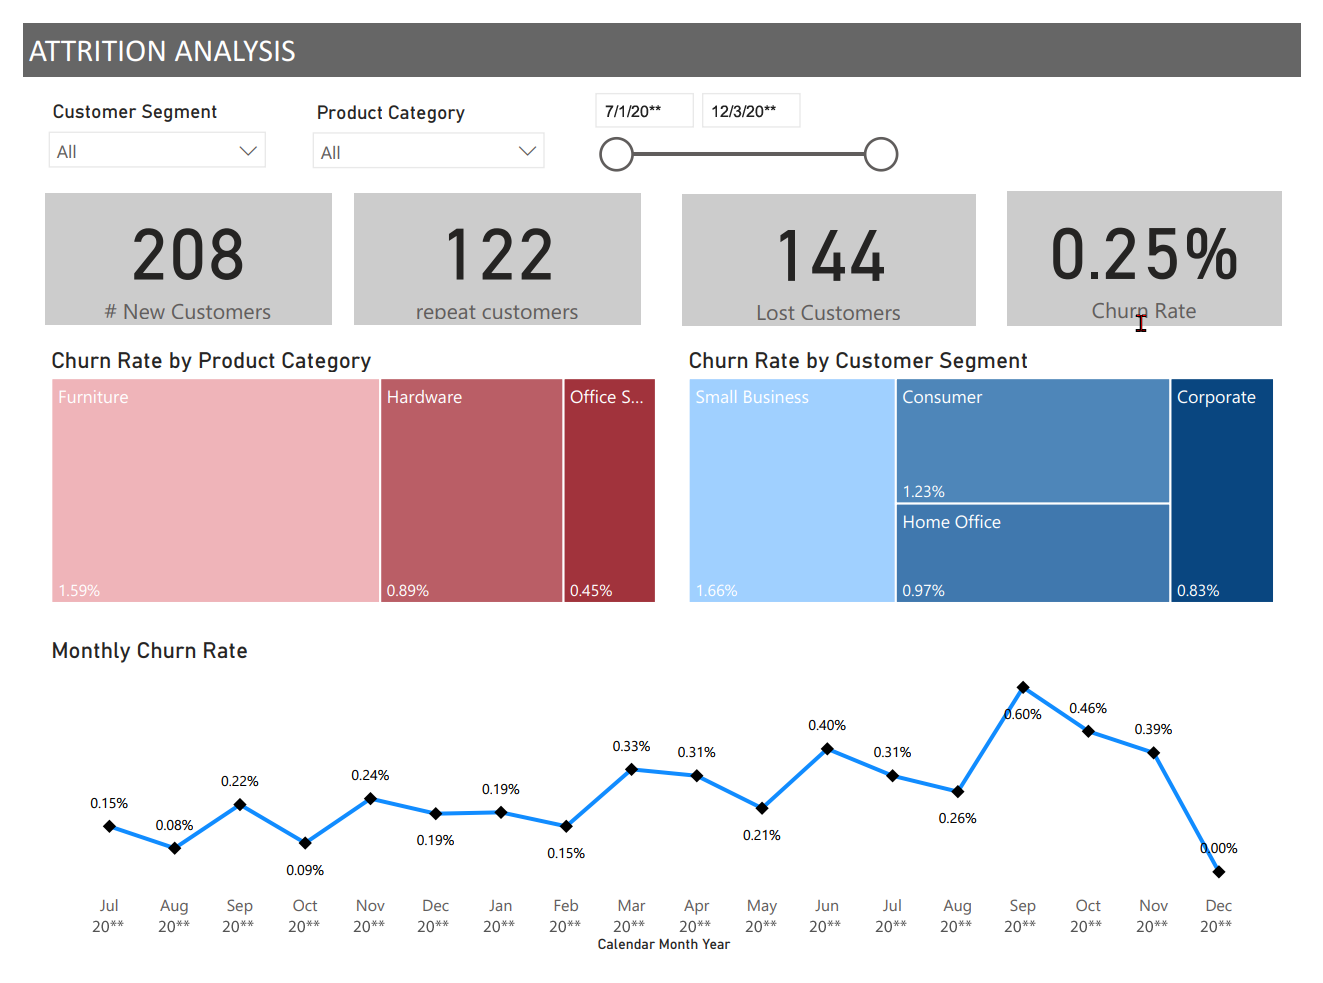
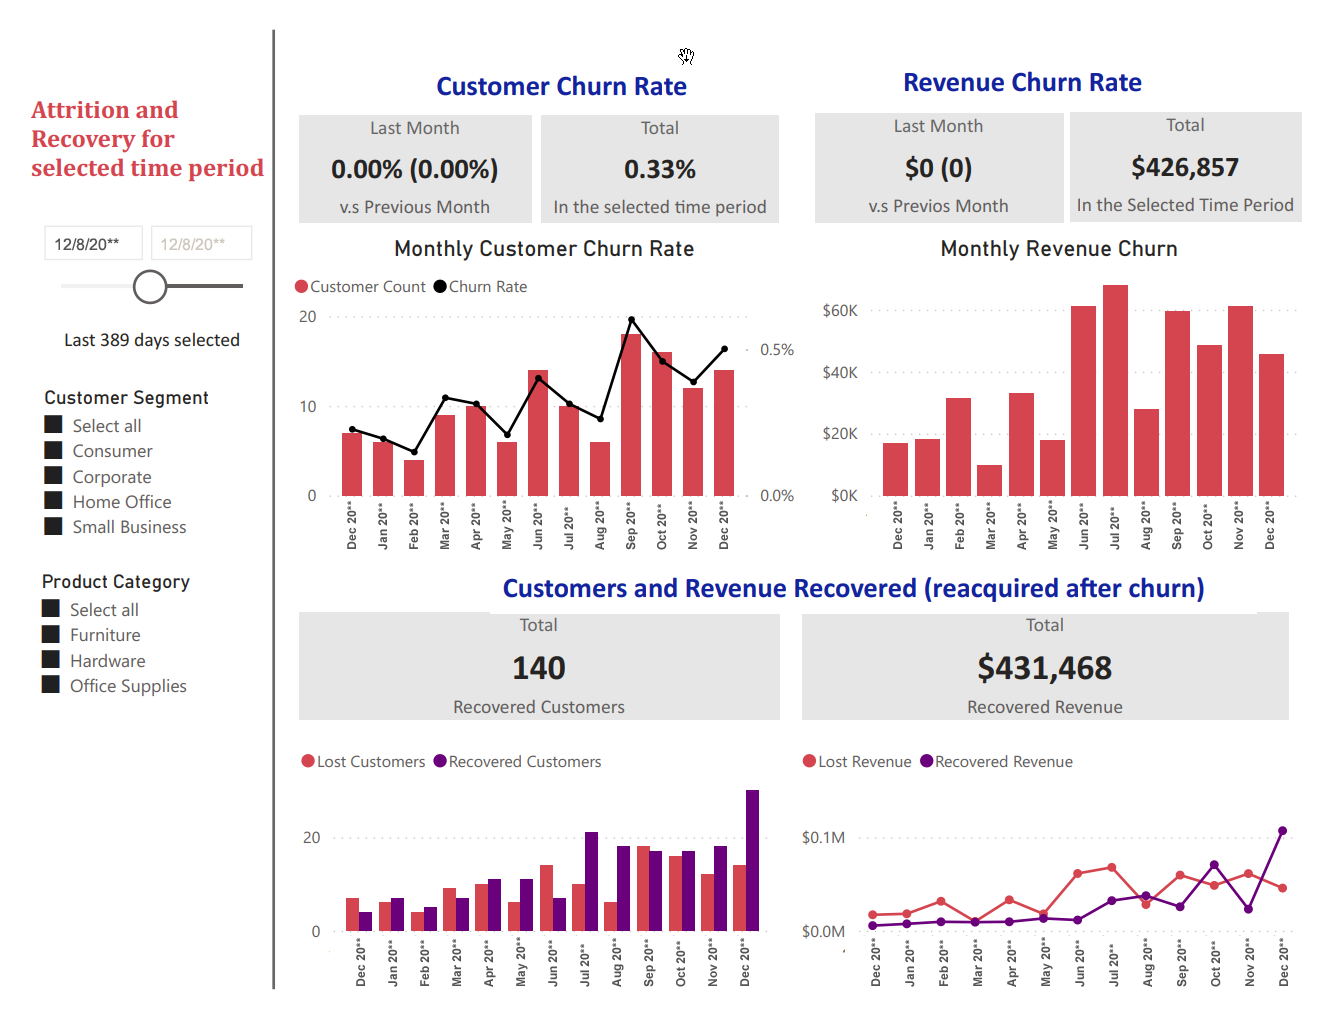
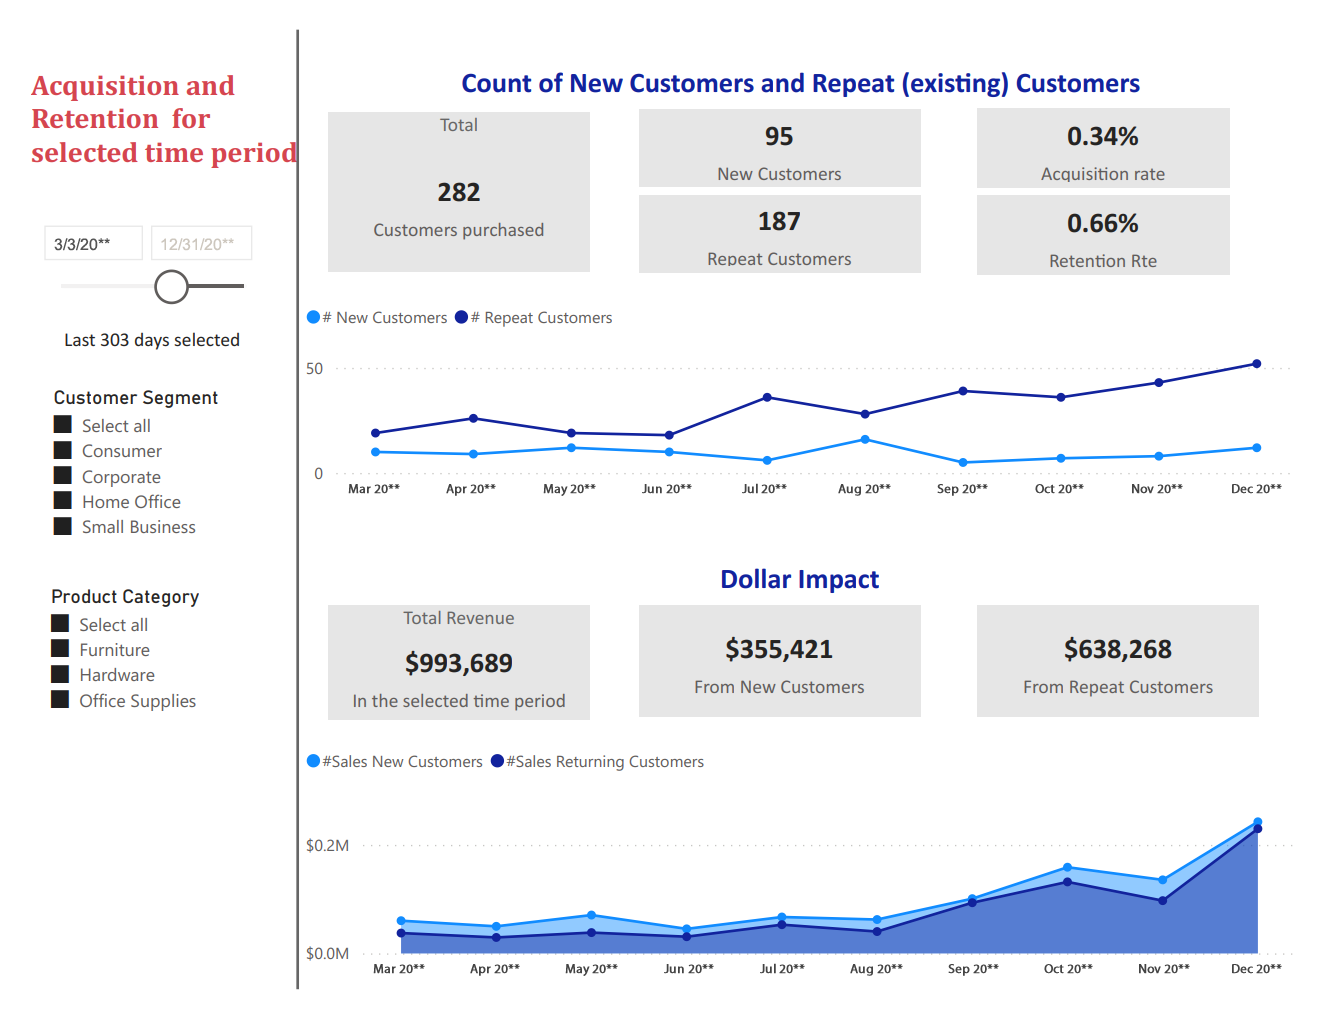
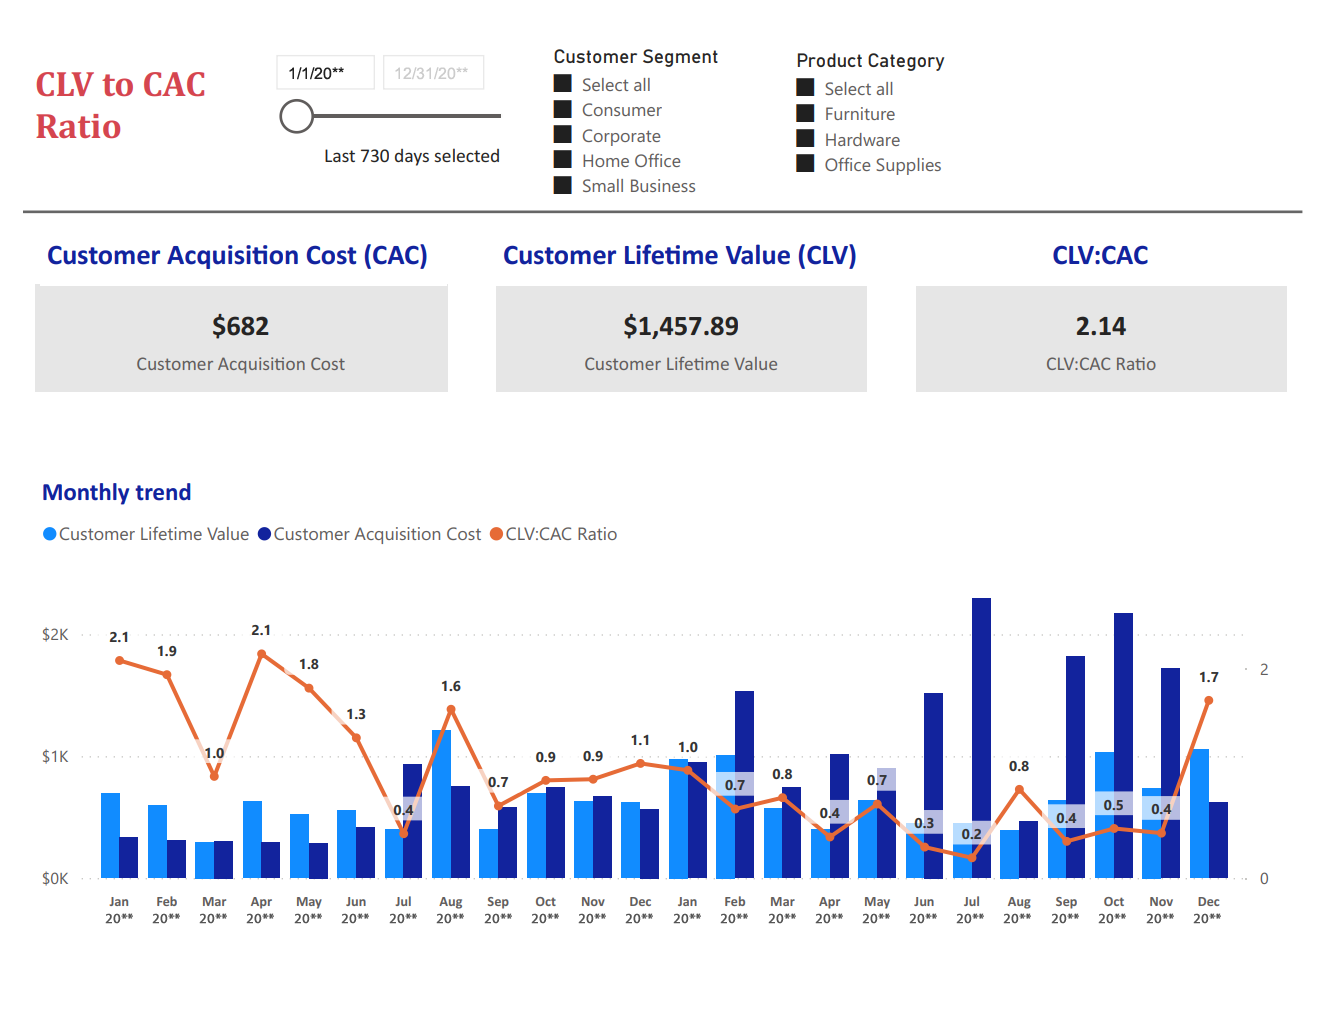
Power BI excels at data visualization, transforming numbers into compelling visuals that resonate with audiences by telling a story.
Some Beyond the Basics Power BI features at Your Disposal :
Visual Arsenal: Power BI boasts a rich library of charts and graphs, each tailored to showcase specific data relationships. From classic bar charts to dynamic heatmaps.
Interactive Storytelling: Power BI users can filter data, drill down into details, and explore trends to build a comprehensive understanding of the information presented with little or no technical help.
Formatting Power BI: Customize visuals with colors, fonts, and layouts to align with brand identity or create a specific mood.
By harnessing the power of data visualization in Power BI, you can transform complex information into clear and impactful narratives, driving better decision-making and fostering a data-driven culture within your organization.))


