logo  gainops  ms  gainops power bi  wh

Power BI Consulting to
Transform your Organization

Unlock powerful data insights to drive better decisions. Our expertise elevates your Power BI, delivering high-quality information for a data-driven future. We supercharge your Power BI, unlocking clear insights for smarter business decisions.
powerBI Logo
We are experts in implementing Microsoft’s Copilot with Business Apps
powerbi copilot  square2

Power BI Maximized

Unleash the full potential of Power BI. Get data-driven insights that empower smarter decisions.

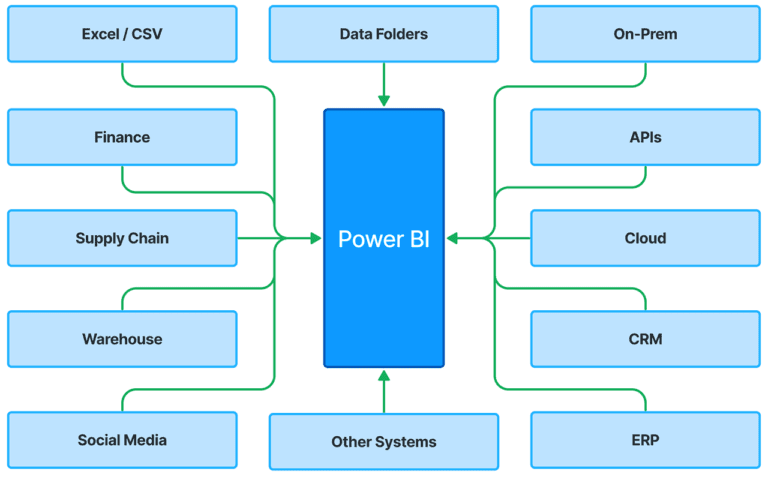
Acquiring DataIn order for Power BI to get data, you need to connect to various types of sources of data: databases, cloud services, worksheets and APIs. Importing data is up to users but they may also feed it live to keep the data up to date. Most businesses have access to a range of data connectors when it comes to the Power BI, through which they can easily transfer data and convert it. To produce accurate and intelligent reports that aid data, driven decision making across organizations, proper data acquisition is essential.

Read More
powerbi sources  new
powerbi workflow  2

Modelling DataCreating meaningful relationships, calculations and insights with data is what modeling data in Power BI means. Defined tables, related to them, building measures and calculated columns with the help of DAX (Data Analysis Expressions) make up part of it. Models how data are related improve reports' performance, accuracy, and usability. Users are allowed to visualize an intuitive way which would help in better data analysis and can ensure whether the data is structured properly and are easy to interpret.

Read More

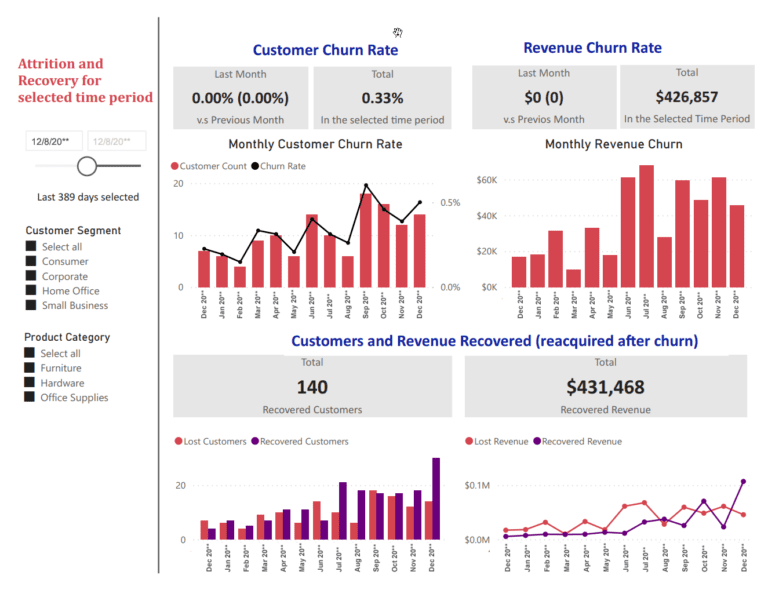
Visualizing DataTo visualize data in Power BI, we generate interactive reports and dashboards by making use of a bunch of charts, graphs, and maps. You can turn raw data into brilliant visualization that highlights the key insights and trends. In that, Power BI presents a variety of visualization options from bar charts, line graphs, up to pie charts, and has custom visuals. With effective data visualization, business users can make better decisions with tougher, more complex information.

Read More
powerbi dashboard  204   churn and recovery
fabric console

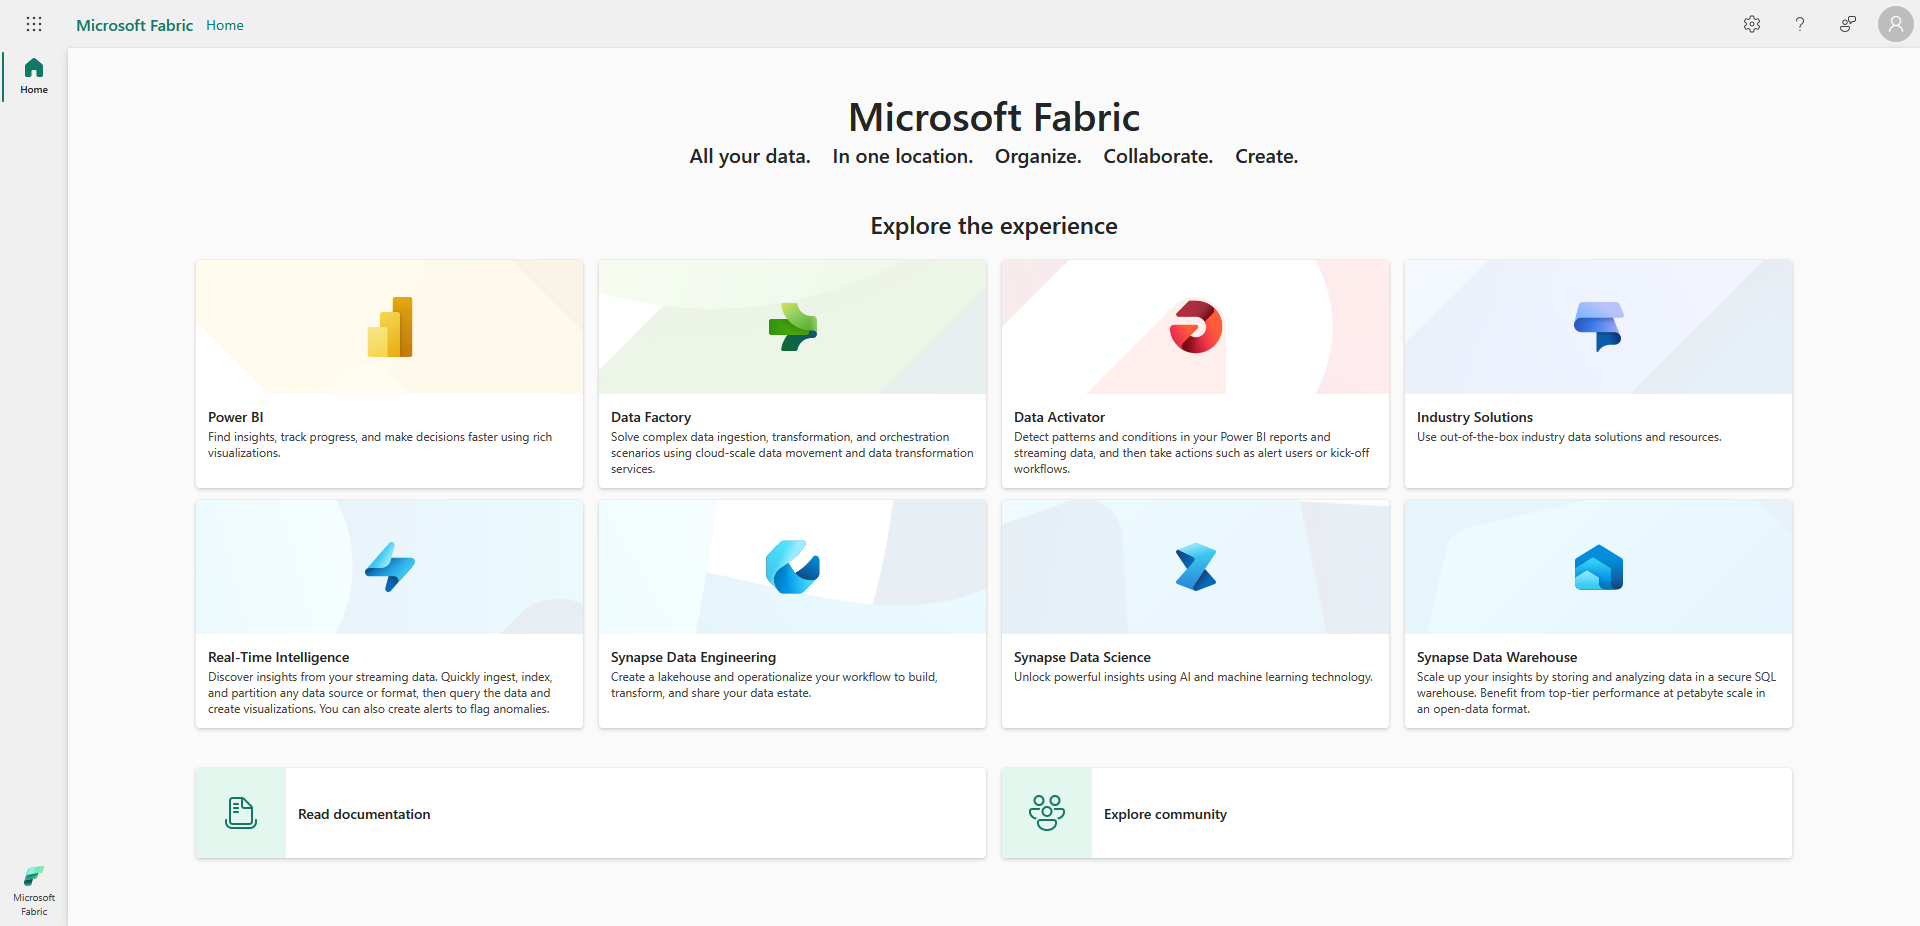
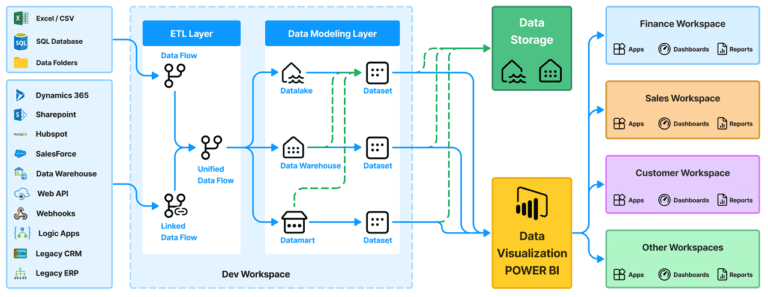
Fabric & Power BITogether Fabric and Power BI increase data analytics and business intelligence on the available fabric. Power BI is oriented to transforming this data into interactive reports and dashboards, whereas Fabric is a unifying data platform for data integration, preparation & management. These tools when combined help organizations streamline the data through flow from data preparation to visualization. And a single data flow from preparation to visualization helps improve decision making and business insights with a cohesive analytics environment.

Read More

Problems We Solve

Some of the Problems we Solve for our Clients
  • Which reps are not meeting quota
  • Which Reps are struggling to meet revenue targets
  • Revenue Forecasts vs. plan / target
  • Customer Acquisition Cost (CAC)
  • Customer Churn
  • Rep Churn
  • Intersection of Sales rep, product and Customer
  • Product 360
  • Org Growth Curve
  • Performance each sales teams
  • Customer satisfaction levels
  • Data from multiple systems / Disparate Data systems
  • Little information but lots of data
  • Incentive compensation (IC) map
  • Where the Reps lose deals / money
  • Discounting Behaviour
  • Supply chain performance
  • Vendor performance
  • Customer 360
  • Rep 360
  • Support ticket status
  • Quote to cash
  • Promise dates
Tell me More

Use GainOps' experts to
implement Power BI

Leverage GainOps' team of expert consultants to unlock the full potential of your organization. Our deep knowledge and proven methodologies can transform how you operate.

Partner with GainOps and unlock the path to sustainable success.
Streamline processes and boost efficiency.
Gain a deeper understanding of your customers.
Optimize costs and maximize profitability.
Empower your workforce to make data-driven decisions.
Achieve a significant competitive advantage.
Why GainOps Consulting

Our team of Power Bi experts will work closely with you to build customized dashboards and scoreboards that provide clear, concise insights at a glance. With our expertise, you can unlock the full potential of your data, identify key trends, and discover actionable next steps that drive business growth. Don't let valuable opportunities slip through your fingers - partner with GainOps today for unparalleled data-driven success!

  • Strategic Conversations
  • Deployment
  • Team Readiness
  • Reporting Standards
  • Security Management
  • Data Governance
  • Compliance
  • Data Architecture
  • Updates / Upgrades
  • Data Culture

GainOps has helped these companies learn more about what's happening inside their own operations, and we've been there to help them with:

  • client logo  row1
  • client logo  row2
  • client logo  row4
  • mobile  client logo  01
  • mobile  client logo  02
  • mobile  client logo  04
  • mobile  client logo  06
  • mobile  client logo  08
  • mobile  client logo  09
  • mobile  client logo  10
Talk to us about your Power BI project

Talk to us about your
Power BI project

linkedin facebook pinterest youtube rss twitter instagram facebook-blank rss-blank linkedin-blank pinterest youtube twitter instagram