Power BI Data Modeling: Shaping the Data for Deeper Analysis
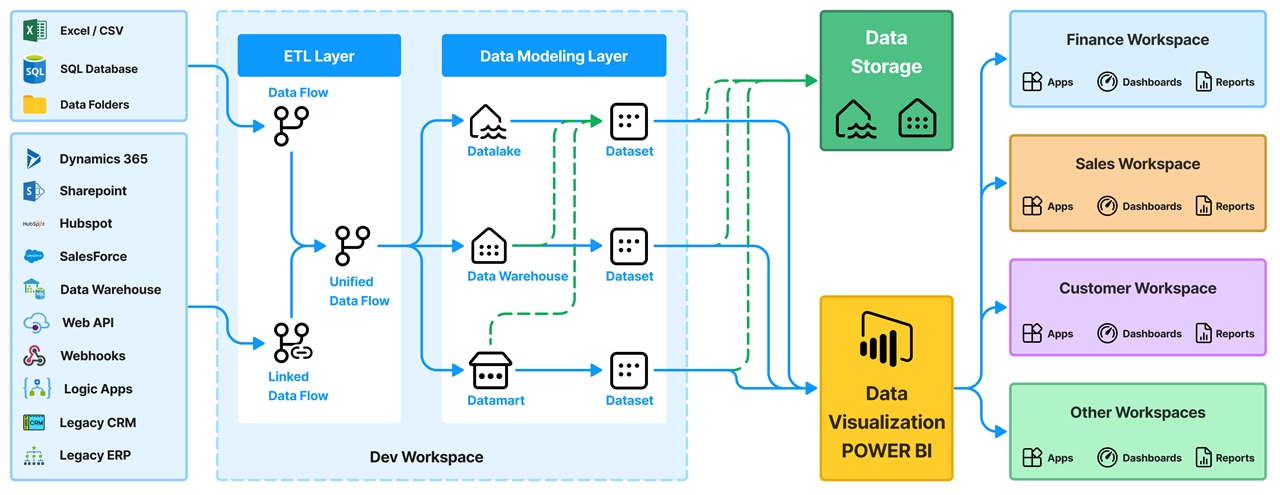
Data Modeling is the art of structuring and organizing your information to enable full potential for analysis. It is the blueprint for data analysis. Once the data is acquired the data needs to be modeled in Power BI. Here's what it entails:
- Tables & Relationships: Data is organized into tables, with each table representing a specific subject area (e.g., customers, products, sales).
- Dimension vs. Fact Tables: Dimension tables provide context and detail (e.g., customer demographics, product categories) while Fact tables contain numerical data for analysis (e.g., sales figures, inventory levels).
- Calculated Columns & Measures: With Power BI you can create calculated columns for missing data
A well-structured data model makes it easier to identify trends, patterns, and relationships within your data.
Power BI offers a user-friendly interface for data modeling, allowing you to visually create relationships and manage the data structures. By investing time in data modeling, you'll be able to tell a story and lay the groundwork for powerful and insightful business intelligence.